Orthophotos, 360 photos and point clouds on one project map
Orthophotos show the whole site, 360° photos show what it looks like on the ground, and point clouds give you the surface in 3D. Put all three on the same map as your designs and as-built data, so everyone on the project reads from the same picture.
Request a demo
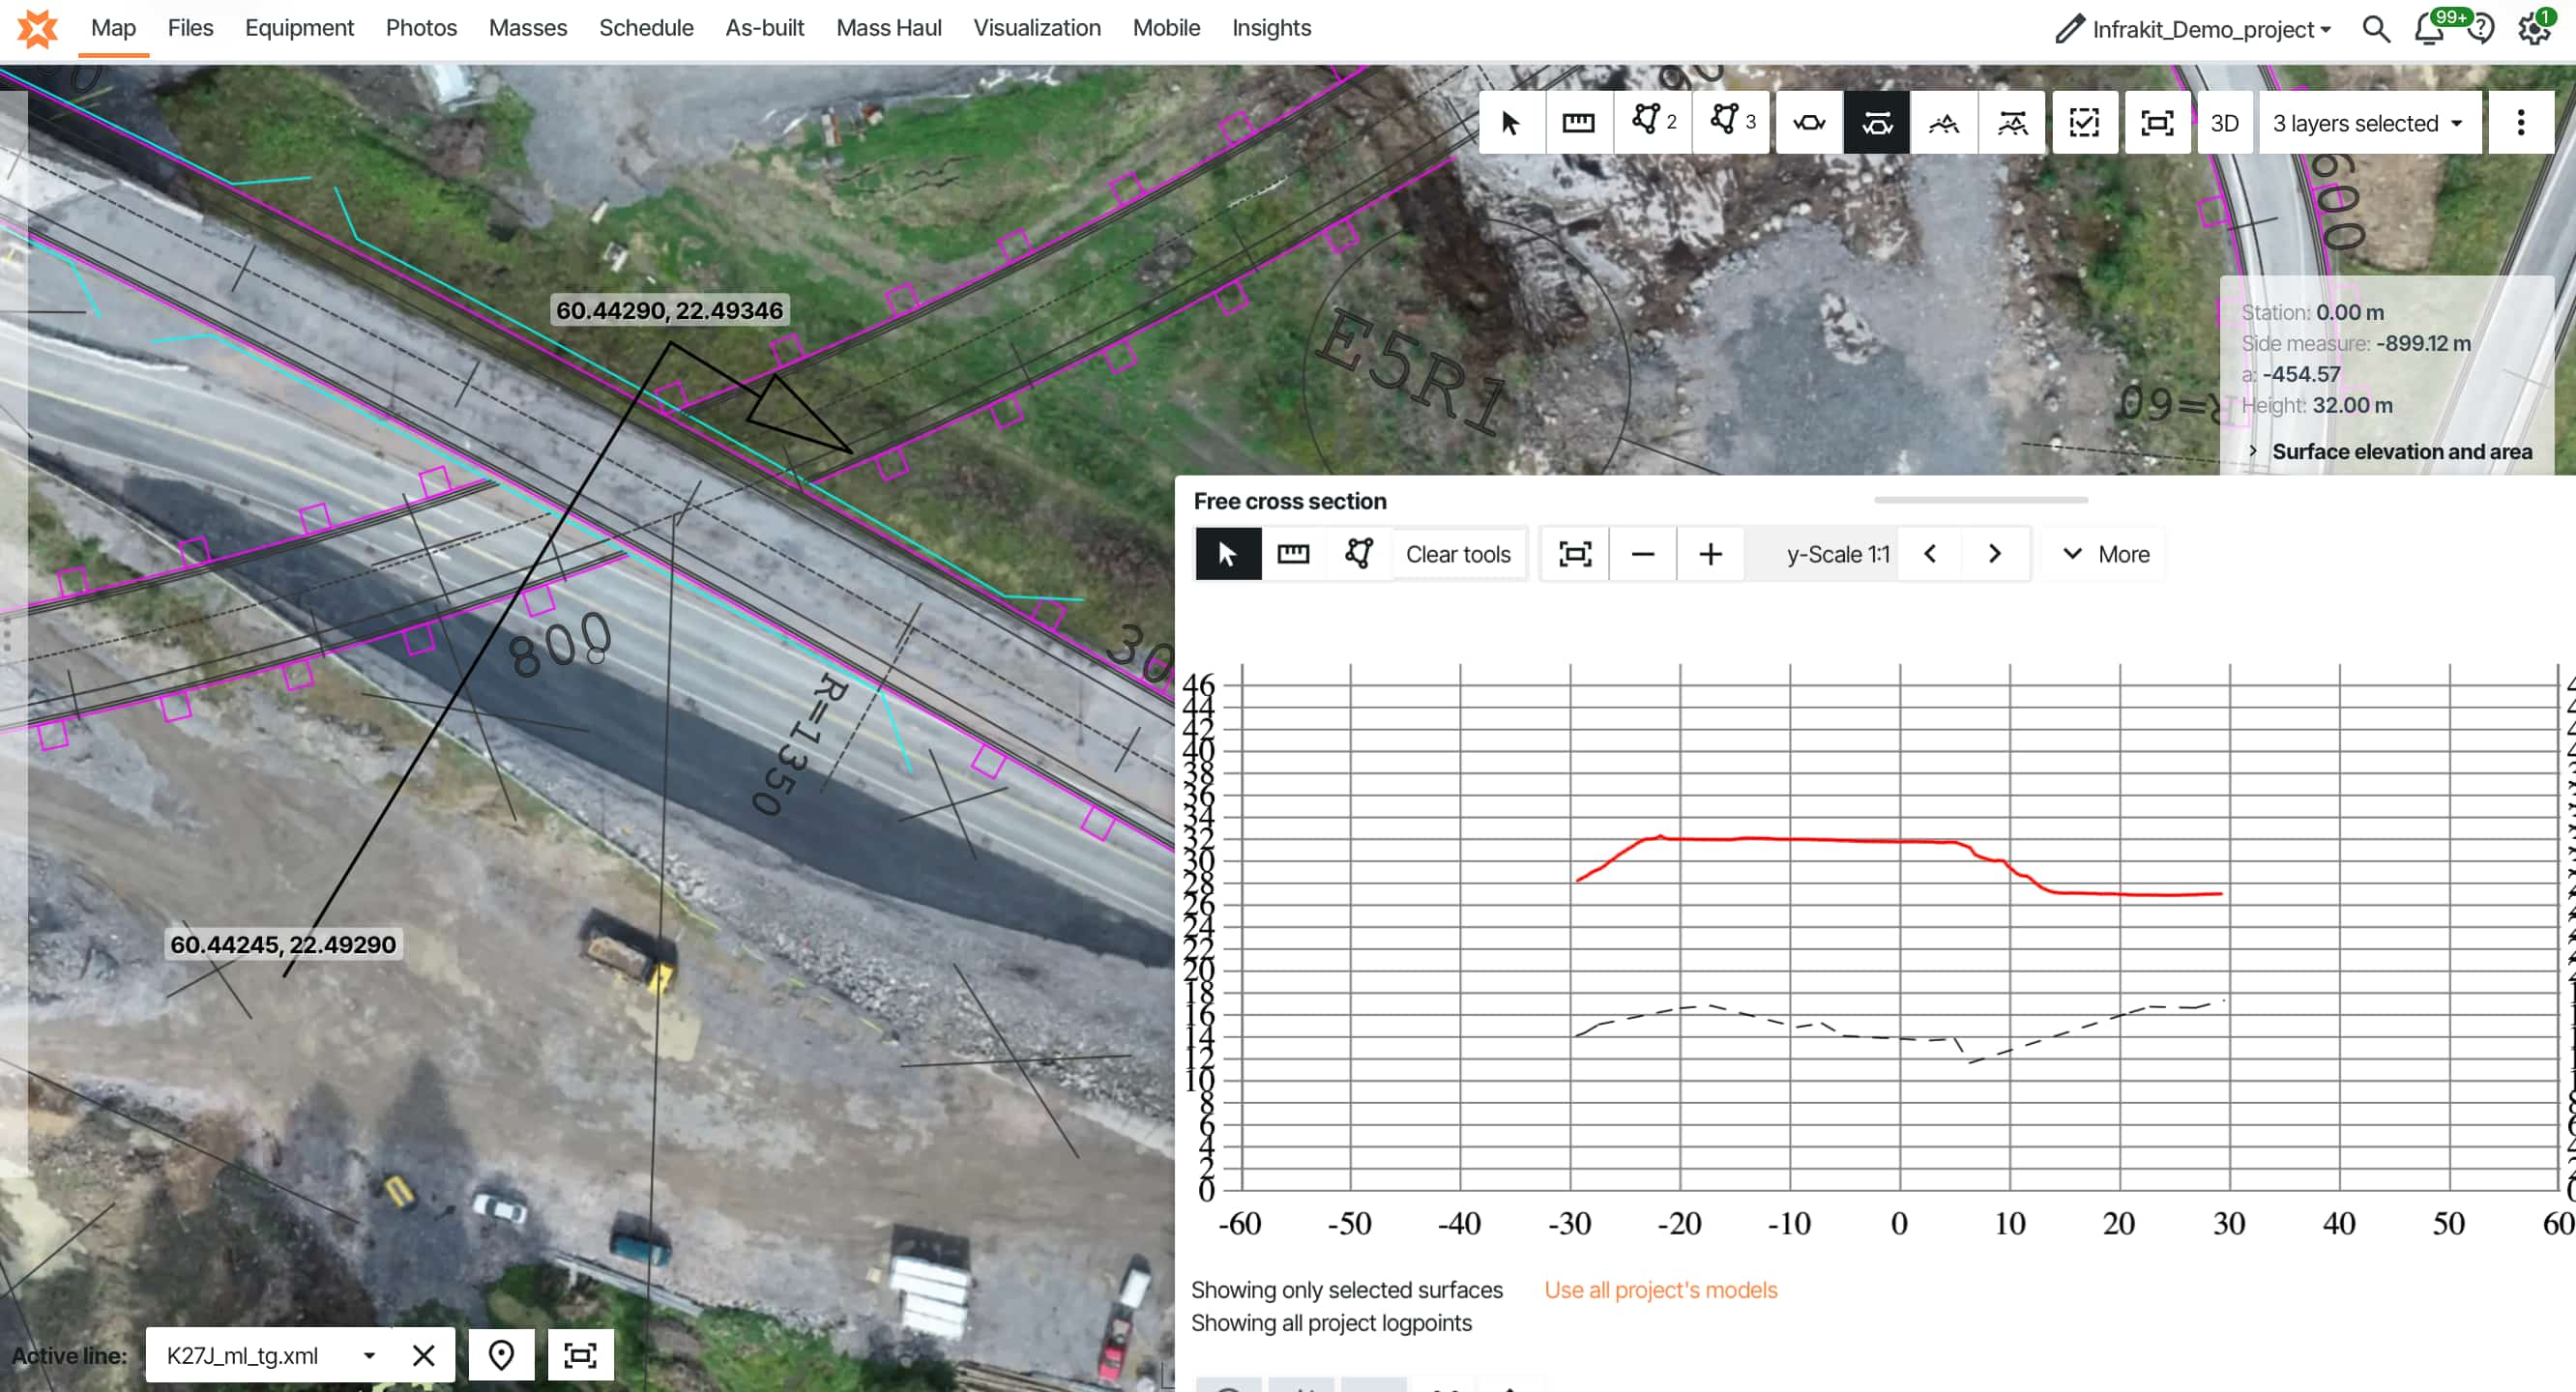
Reality capture pays off when people can find it next to the design. Load orthophotos, 360° photos and point clouds into the same Infrakit project, and site managers, surveyors, foremen and the owner compare them with the design on one map instead of opening three separate tools. This page covers what each data type is good for, how they work together, and where other tools still do the job better.
Civil sites now collect more visual data than ever. A drone provider flies the site every week or month. Foremen take photos on their phones. Some teams capture 360° photos while walking the alignment, and a surveyor produces point clouds for volumes.
The capture is rarely the problem. The trouble is that each data type ends up somewhere different: the orthophoto in the provider's portal, the 360° photos on someone's laptop, the point cloud in software only one person can open. When the owner asks what a section looked like before backfill, someone spends an afternoon looking for it.
Infrastructure adds one more twist. A road or rail project runs for kilometres, so a photo is only useful if you know exactly where along the alignment it was taken and what the design says there.
The fix is easy to describe: put every capture on the project map, at its real location, next to the design and as-built data. Here's how the three data types differ, why they work better together and how teams set it up.
What orthophotos, 360 photos and point clouds each show
An orthophoto is a drone or aerial image corrected so that every pixel sits at its true map position. It works like an up-to-date base map: you can measure on it and lay designs over it.
A 360° photo captures everything around the camera from one spot. It shows what the site looks like in every direction, so you can stand at a location without driving there.
A point cloud is a set of millions of measured 3D points on a surface, from photogrammetry or laser scanning. It's the data type you need when the question is about heights, slopes or volumes.
None of them replaces the others. The table shows which question each one answers.
| Data type | What it answers | Typical source | Common file formats |
|---|---|---|---|
| Orthophoto | Where is everything now? Haul roads, stockpiles, excavation edges and structures against the design. | Drone flight processed in photogrammetry software, by your surveyors or a provider | GeoTIFF / TIF or JP2 with embedded georeferencing |
| 360° photo | What does it look like here? Structures, utilities before backfill, conditions at a given chainage. | 360° camera on foot, on a pole, on a vehicle or on a drone | JPG (equirectangular) |
| Point cloud | How high, how steep, how much? Surfaces, slopes and volumes. | Photogrammetry from the same drone flight, or laser scanning | LAS, LAZ, E57 |
| Terrain model (DEM) | How much has moved? Volume differences between two dates or against the design. | Generated from the point cloud | GeoTIFF / TIF |
Orthophotos, 360° photos and point clouds next to designs and as-built data.
Request a demo Support guide: 360° photosWhy they work better on one map
Each data type answers part of a question; together they answer all of it. The point cloud shows that a section is below design. The orthophoto shows why: rock that wasn't in the ground survey. The 360° photo from the same spot shows what the excavator operator saw.
Location is the link. A photo called IMG_4821.jpg tells you nothing. The same photo pinned to its position, next to the alignment, the design model and last week's orthophoto, tells you exactly what you're looking at.
Time is the second link. Orthophotos from different dates show how the project developed. Teams use older ones to identify earlier installations that turn up during excavation, or to answer questions about what was built when.
Everyone sees the same thing. When the site manager, the surveyor, the subcontractor and the owner open the same map, the conversation moves from “which file are you looking at?” to the actual problem.
Veidekke's team on Lundbyleden in Gothenburg maps the site with a drone every week and loads the new orthophotos into Infrakit. In one case an orthophoto showed that a planned footpath and cycle path could conflict with a neighbouring property and hedge, something that wasn't as clear on the drawings.
Simply put, the drone flight takes a morning. Without one shared map, finding and combining the results eats into every week that follows.
How it works in Infrakit
Your drone provider, survey team and cameras stay the same. What changes is where the results end up and who can use them.
Orthophotos and terrain models on the map
Bring drone orthophotos and terrain models (DEMs) into the project and compare them with the design on the map.
360° photos as panoramas
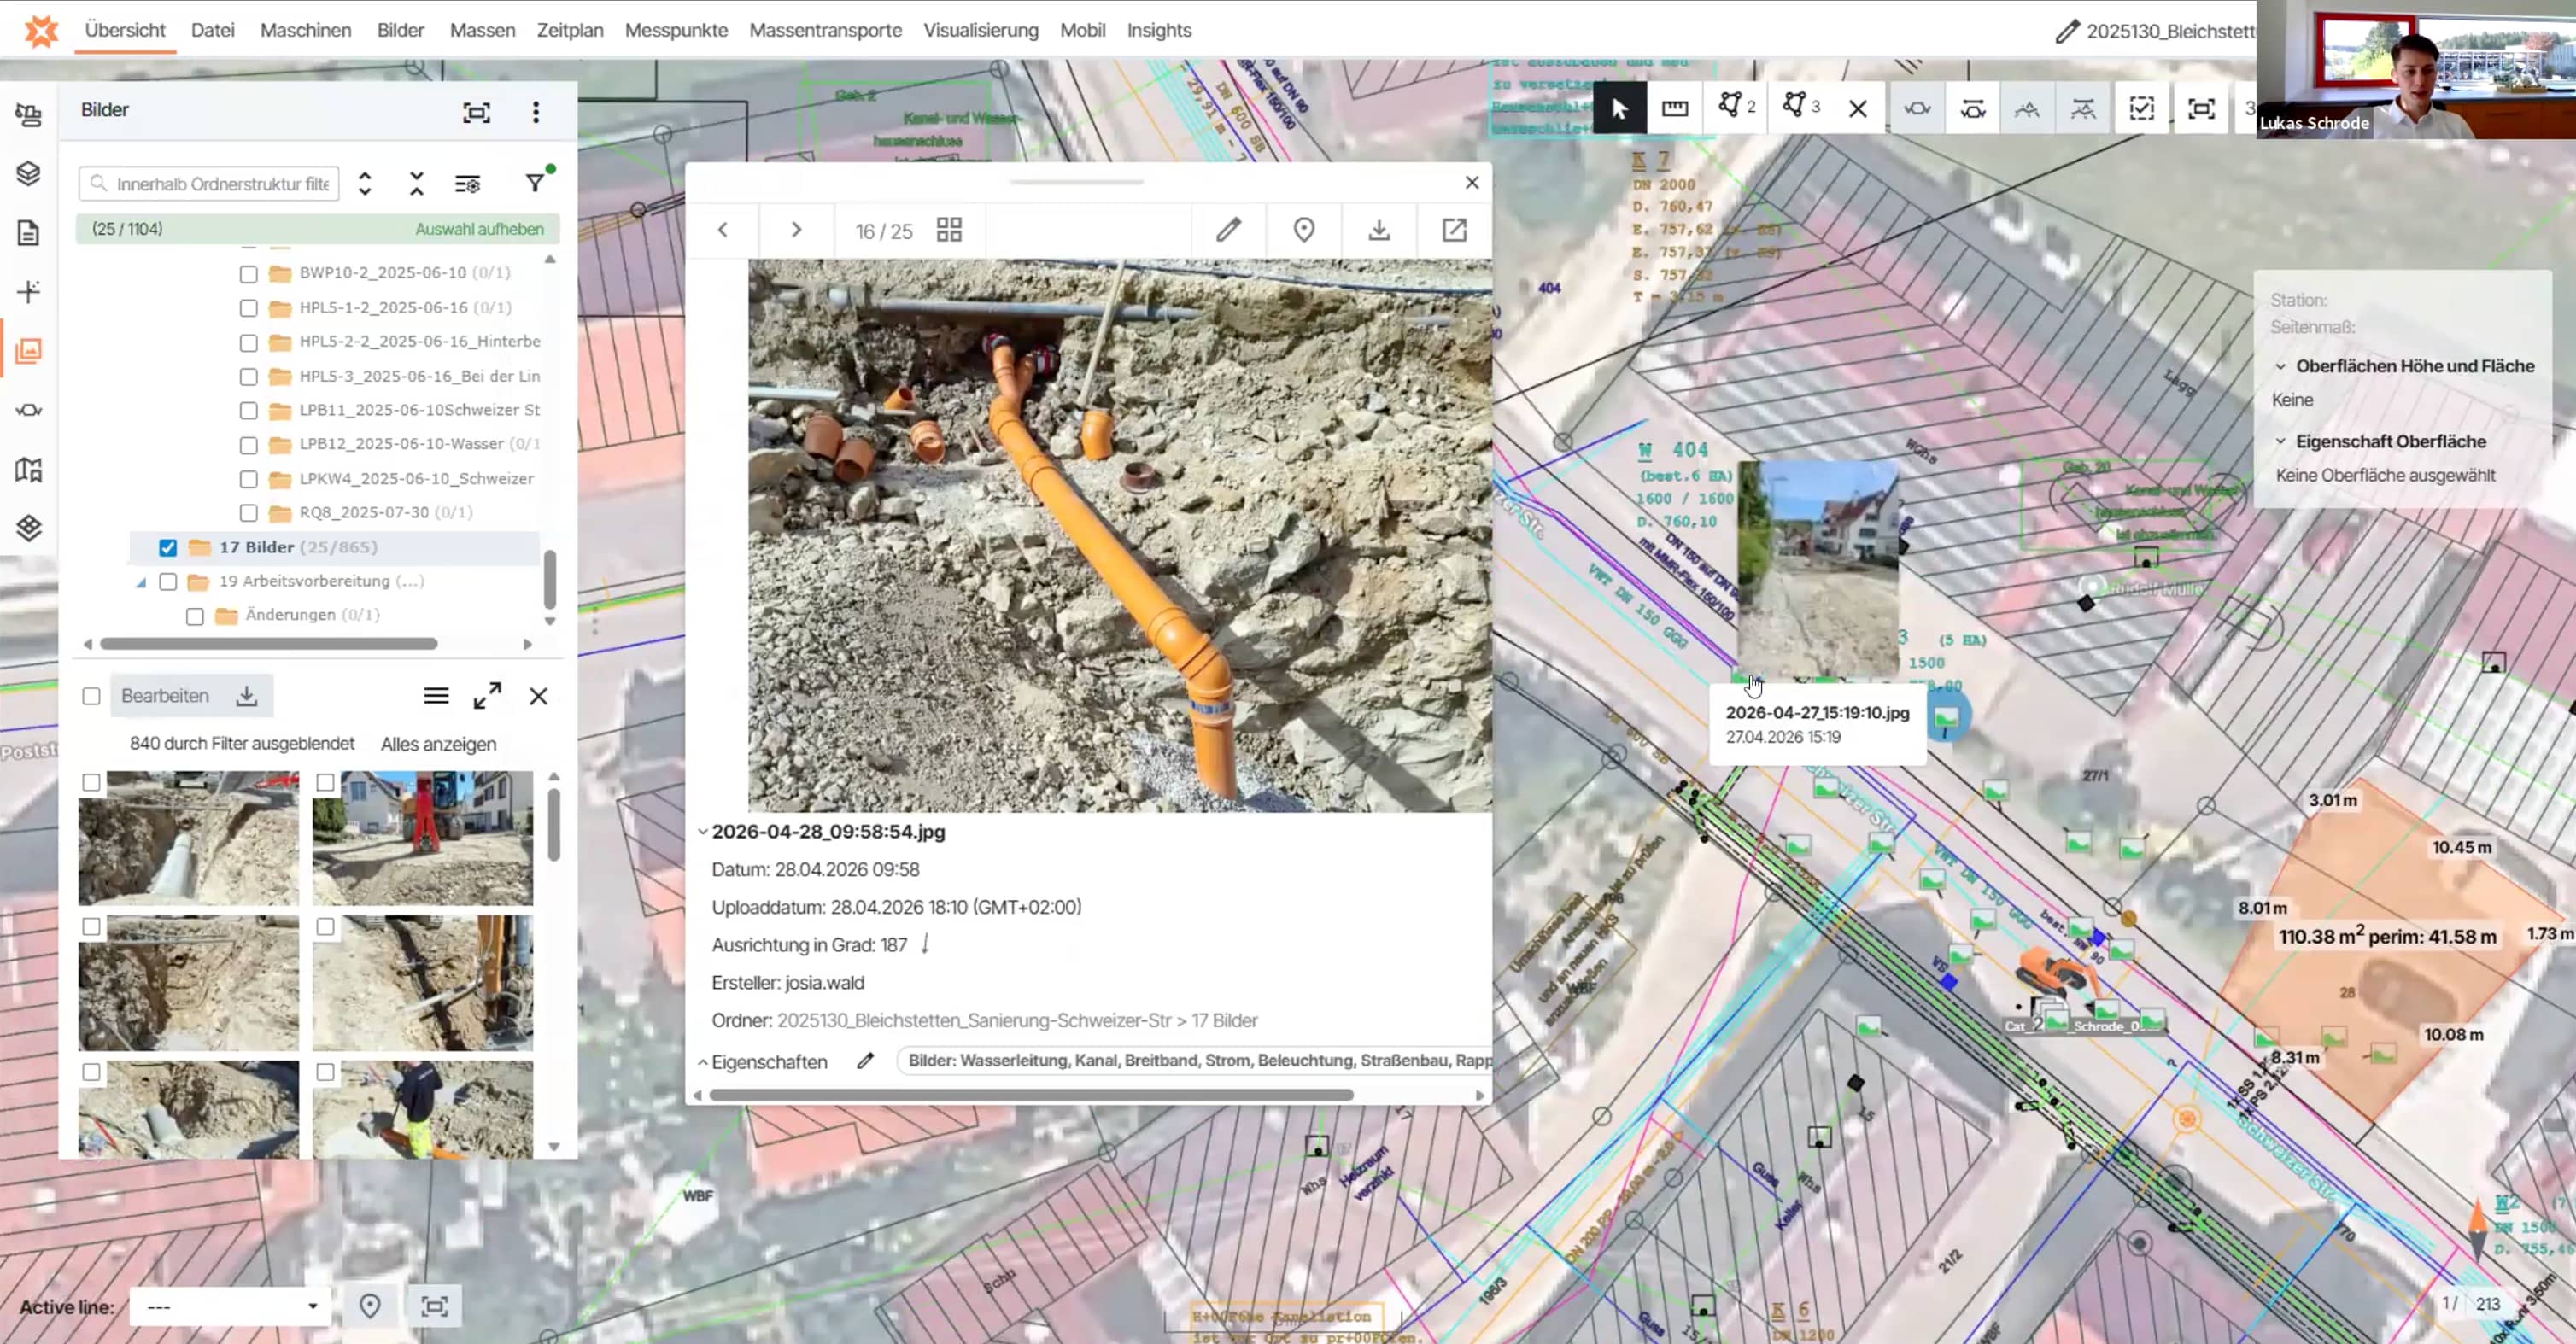
Bring 360° photos into the project and view them as panoramas, moving from one to the next with a configurable jump distance.
Point clouds in 3D and in cross sections
View LAS and LAZ point clouds in 3D, show point cloud slices in cross sections, and calculate volumes between DEMs, models and point clouds in any combination.
Compare, comment and share
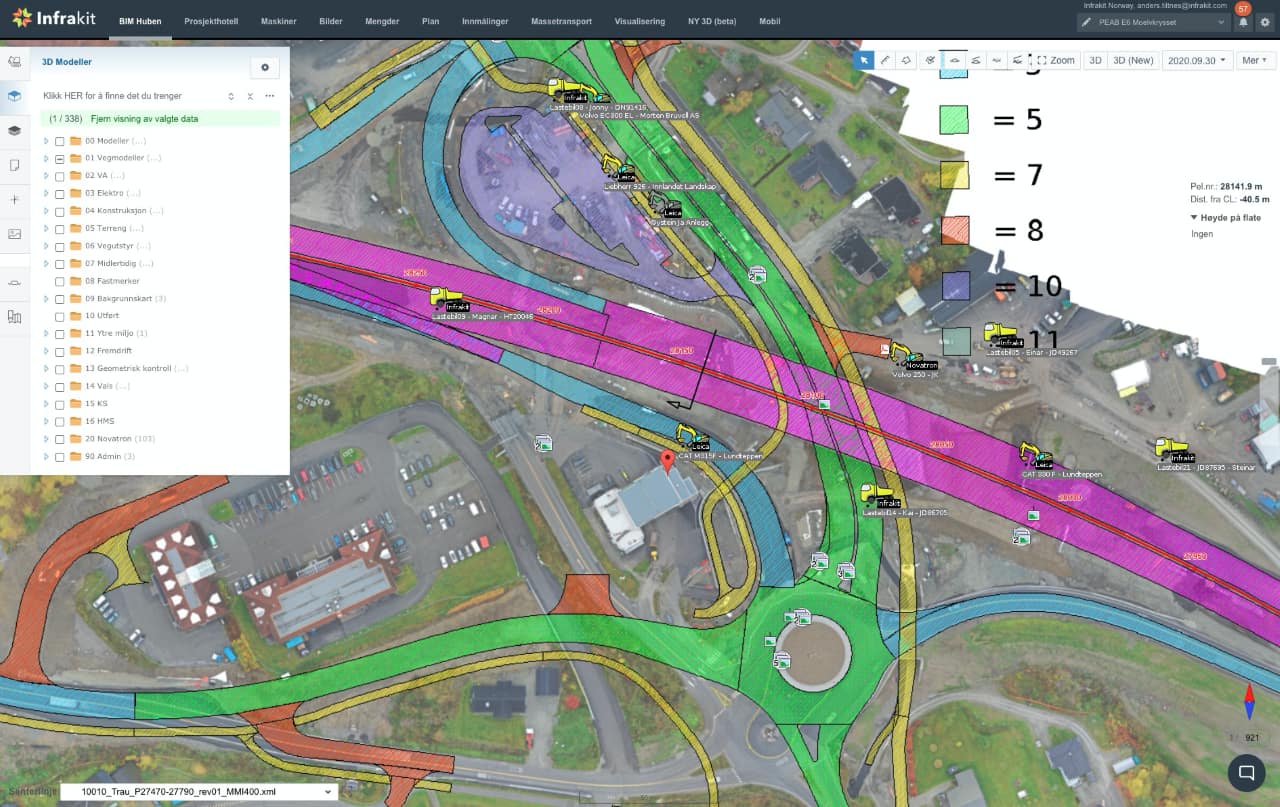
Lay designs over the orthophoto, adjust the opacity of models and drawings, measure distances and areas, and save the view with comments so the team opens exactly what you saw.
See your own site on one map
Bring a recent orthophoto, a few 360° photos and a point cloud from one of your projects. We'll show you how they look next to your design and as-built data.
“One feature I think is underrated is the ability to compare, for example, multiple layers of orthophotos and model base data. It provides a quick visual overview of progress, changes, and deviations. …”
Mari Træen Surveying manager, Romarheim AS · Read the interviewWhere teams use it on site
Progress and payment. Regular orthophotos give a measured picture of progress instead of an estimate. Tieluiska in Finland uses saved views that show a payment item's completion, attachments, set-out points and as-built measurements on top of the orthophoto, which makes approval transparent and easy to check.
Volumes. Two terrain models from different dates, or a terrain model against the design, show cut and fill without walking every control point.
Buried work. Drainage, cables and base layers disappear under backfill. An orthophoto and 360° photos from installation week are often the only visual record of what went into the ground.
Distance. On linear projects, checking a detail on site can mean an hour or two of driving. Destia's team on the Mutkalampi wind farm, with 69 km of new road, measured from drone images in Infrakit instead.
Meetings and coordination. An orthophoto on the screen helps planners, foremen and subcontractors point at the same thing. PEAB used monthly orthophotos in daily meetings on E6 Moelvkrysset, and subcontractors oriented themselves in the field through the app.
Owner communication. When the owner opens the same map, questions about what was done and when get answered with a picture instead of a report.
“The problem is that many construction companies have digitized a great deal, but if they can’t bring all that information together, data scattered across different systems is just as useless as having no data at all.”
Lukas Schrode Managing Director and Site Manager, Schrode Bau · Read the storyWhere Infrakit fits, and where other tools do
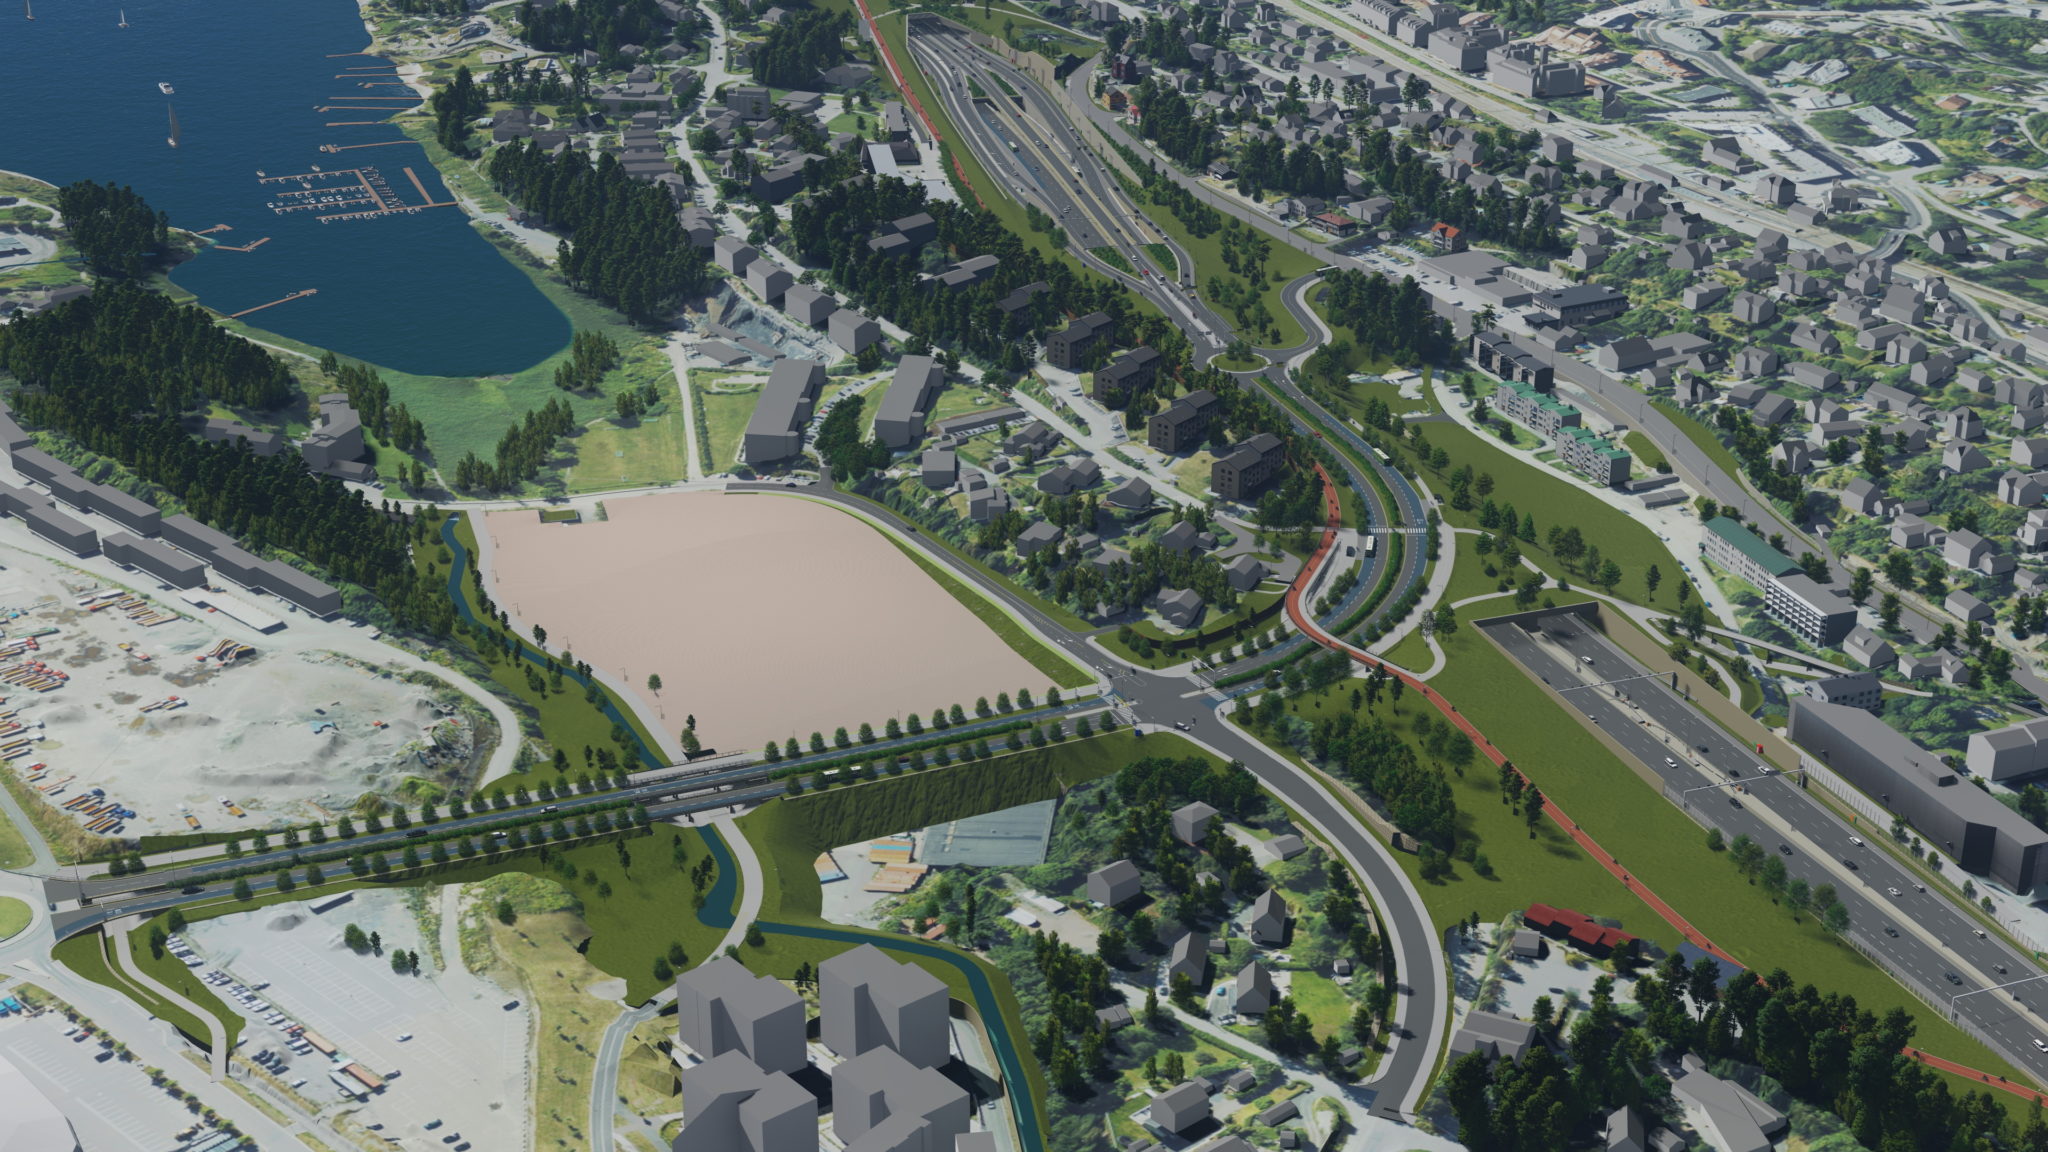
Infrakit is where captures meet the design and the people who build it. It doesn't replace every tool in the chain.
Processing drone images
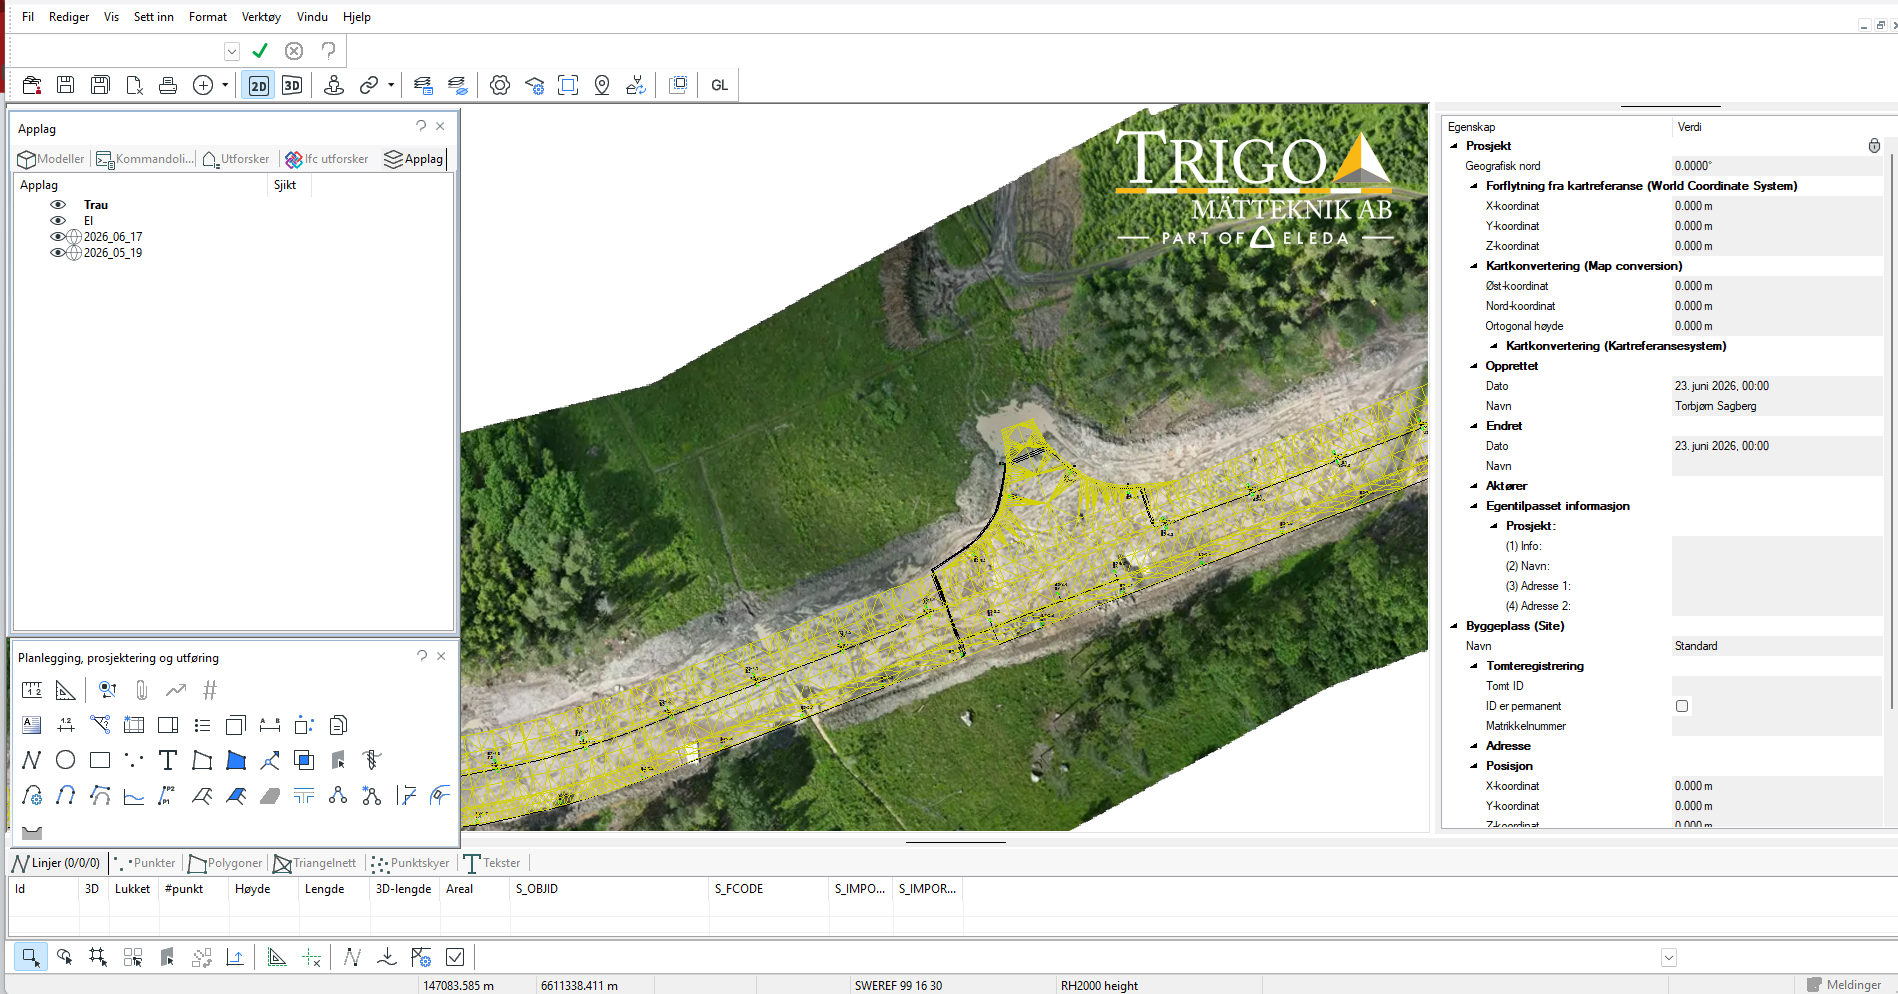
Turning raw drone images into an orthophoto, point cloud and terrain model happens in photogrammetry software, run by your surveyors or a drone service provider. Infrakit is where the results get used.
Detailed point cloud work
Classifying, cleaning or modelling from large laser scans belongs in dedicated point cloud software. In Infrakit, point clouds are for viewing in 3D and in cross sections, and for volume calculations.
Design and CAD
Designers keep working in their own CAD and design tools. Infrakit brings in data from design software such as Civil 3D, Quadri, Novapoint and Gemini.
Frequently asked questions | What is the difference between an orthophoto and a 360° photo? + An orthophoto is a measurable top-down map image of the whole site, while a 360° photo shows everything around one point in every direction. Use the orthophoto to see where things are and to measure, and the 360° photo to see what a spot looks like. Can we keep our current drone provider and software? + Yes. Infrakit works with the outputs your provider already delivers: drone orthophotos and terrain models, for example as TIFF, and point clouds as LAS or LAZ. How do 360° photos work in Infrakit? + You bring 360° photos into the project and view them as panoramas, jumping from one to the next with a configurable jump distance. The support guide on 360° photos explains how to upload them. Can point clouds be used for volumes? + Yes. Infrakit calculates volumes between DEMs, models and point clouds in any combination, and can show point cloud slices in cross sections. How often should we fly the site? + It depends on how fast the site changes and what you use the data for. Veidekke maps Lundbyleden every week, while PEAB flew E6 Moelvkrysset once a month; phases with heavy earthworks usually need more frequent flights than finishing phases. Who can see the data? + People invited to the project see what their role, user group and folder rights allow. On site, they open designs, saved views and data layers on a phone or tablet. |
