
Construction field reporting and photo documentation for infrastructure
GPS-tagged photo documentation, real-time site visibility, and standardized reporting — so you can find any photo in seconds, even years after construction ends.
Request a demo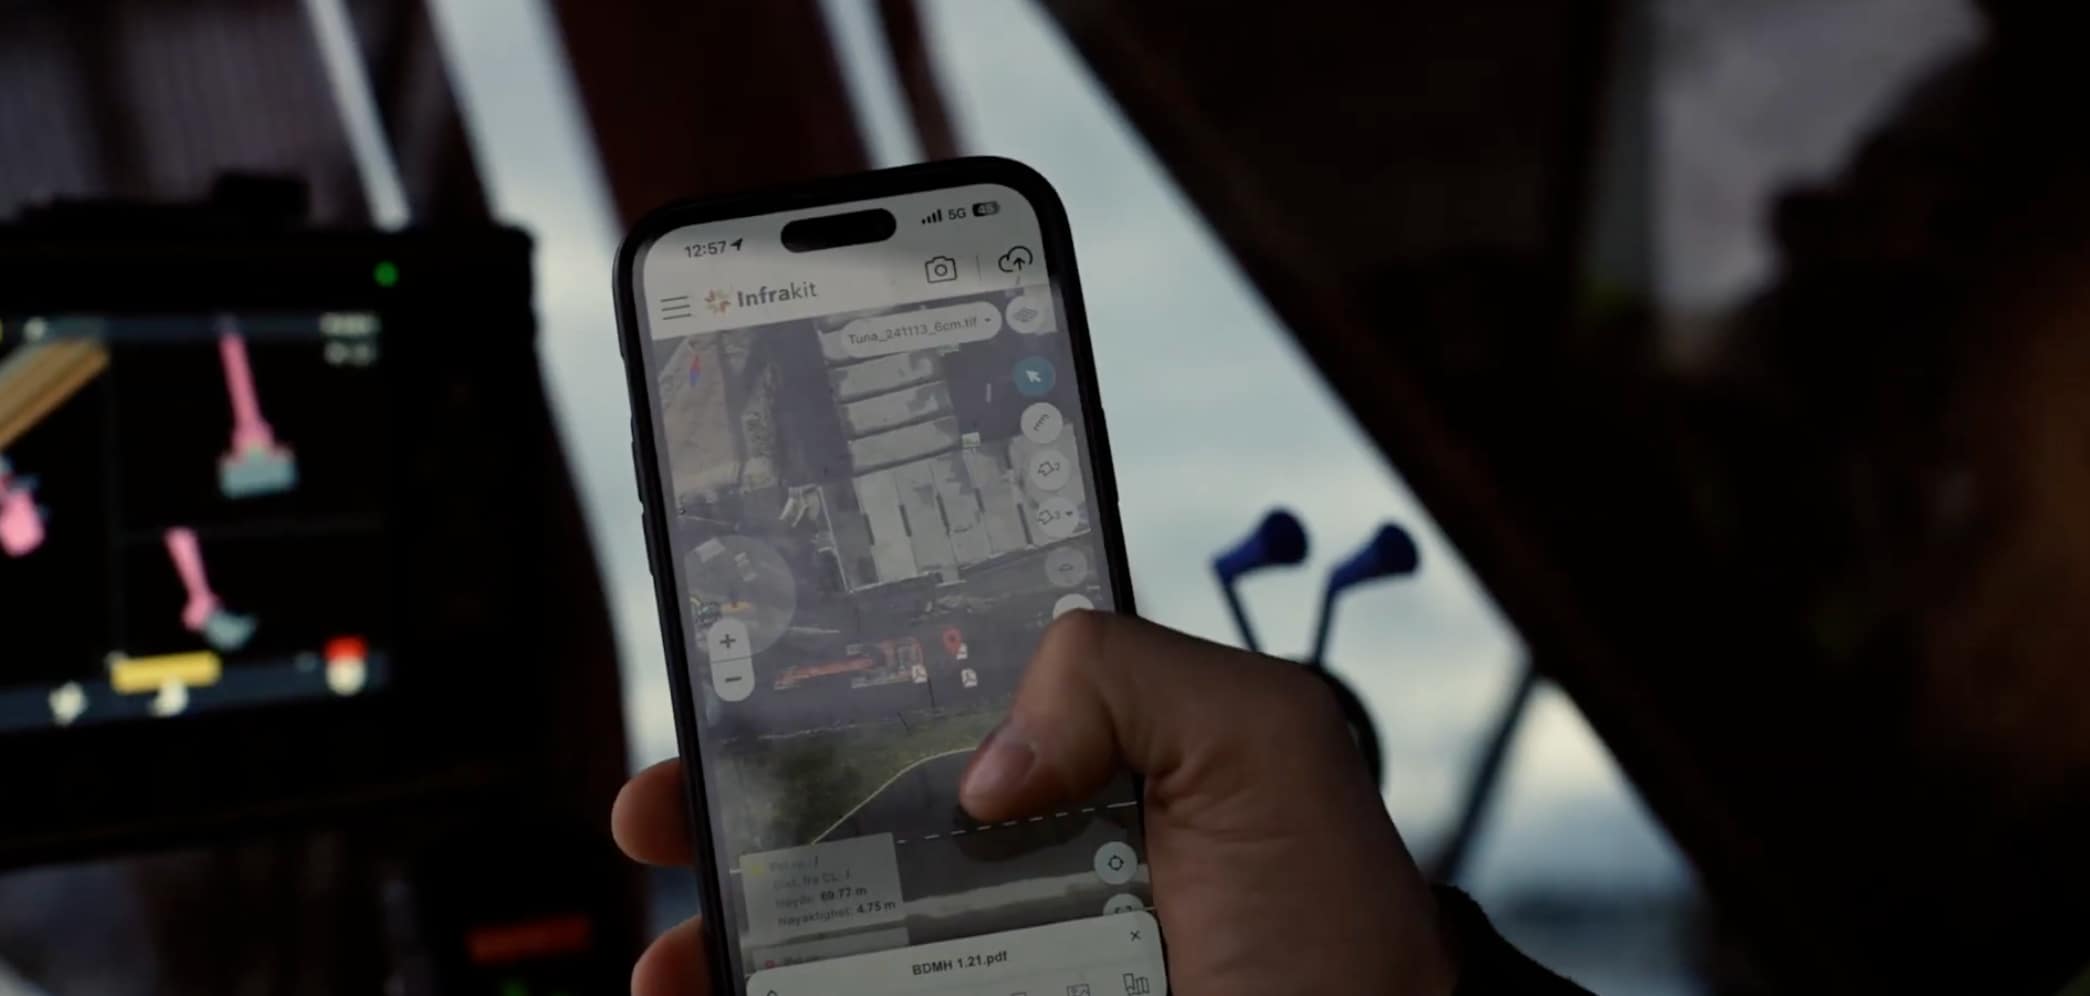
Why construction field reporting fails on infrastructure projects, how GPS-tagged photo documentation eliminates the photo-hunt problem, and how teams on 30km+ projects organize location-based documentation that proves quality during construction and years into the warranty period.
Here's something that happens on almost every large infrastructure project: Someone needs a photo from six months ago. Maybe it's for a warranty claim. Maybe it's because the project owner wants to verify how something was installed. Or maybe there's a dispute about whether work was done to spec.
And nobody can find it.
Your site manager checks the project folder. Nothing. Asks the foreman who was there that day. "I think I took it on my phone, but that was before I switched devices." Tries the group chat. 10,000 messages back. Searches email threads — six different conversations with "drainage photos" in the subject. Opens each one. Wrong location. Wrong date. An hour later, still searching. The warranty claim decision is on hold.
Investigation costs are mounting. And somewhere, that photo exists — probably on someone's old phone, or buried in a backup drive, or in a text thread that got deleted.
On a 30-kilometer highway project spanning three years, you're not looking for one photo. You're looking for the right photo among 50,000 others. And you need to find it quickly because delays cost money.
Construction field reporting—the systematic capture and organization of site documentation, photos, measurements, and daily progress—should prevent this. But in practice? Many infrastructure teams are still piecing together information from personal phones, email chains, and various disconnected systems.
The thing is, tools designed for building construction don't work well for infrastructure. A contained building site is fundamentally different from a linear project stretching dozens of kilometers.
Let's talk about what actually works.
What is construction field reporting?
Construction field reporting is the systematic capture and organization of site documentation — photos, measurements, daily progress, safety observations — in a way that's retrievable years later. Not just captured. Retrievable.
Photo documentation is where most projects fall short. Photos need to prove work was done correctly, document issues before they get buried, and survive warranty claims that surface five or ten years later. That only works if they're tagged by location the moment they're taken.
On one Estonian road project, site engineers photographed every defect in the lower asphalt layer with GPS coordinates. Years later when issues appeared in the top layer, they pulled up those exact photos to determine the cause — eliminating guesswork and saving significant investigation costs.
Daily reports create the same problem. When every foreman files them differently — emails, spreadsheets, paper — compiling project-wide status becomes a full-time job. Standardized mobile templates fix this: fill out on a tablet in minutes, organized automatically by location and date.
The real shift is from "I'll document this when I get back to the office" to "I'm documenting it right now." Problems get caught before concrete sets, before layers get buried, before rework becomes necessary.
"Previously print-outs were the only way to see measurements were done right — now all relevant data can be seen by everyone. Before we had metres of quality control folders. Now it's all in one place." — Heino Karjalainen, Site Manager, Destia
Why infrastructure projects need different tools
A lot of construction software gets marketed as "works for any project." That's not really true. What works for a single building on a contained site doesn't work for 30 kilometers of highway. Scale kills simple solutions — work happens simultaneously at locations kilometers apart, often in remote areas with spotty connectivity. On YIT's E18 project, design material ran to 40,000 pages, construction docs to 70,000, plus 50,000+ photos.
Multi-year timelines complicate things further. A three-year infrastructure project needs systems that survive staff turnover — data from year one must remain accessible in year three. Location precision matters in ways it doesn't for buildings. Infrastructure works in station numbers and chainage. "Near the interchange" doesn't cut it. You need "station 12+340". GPS coordinates aren't nice-to-have — they're essential.
This becomes critical during warranty periods. Most infrastructure carries 5–10 year warranties. When defects show up years after construction, you need documentation from that exact location. And here's what makes infrastructure fundamentally different: you can't dig things up to check them. Once you bury drainage systems or base layers, they're buried — excavating to verify costs tens of thousands. Photo documentation is your only proof of what's under there. See how Infrakit Field handles infrastructure documentation →
Real benefits for contractors and site teams
The shift from scattered documentation to GPS-organised field reporting changes what's possible — both during construction and years after handover.
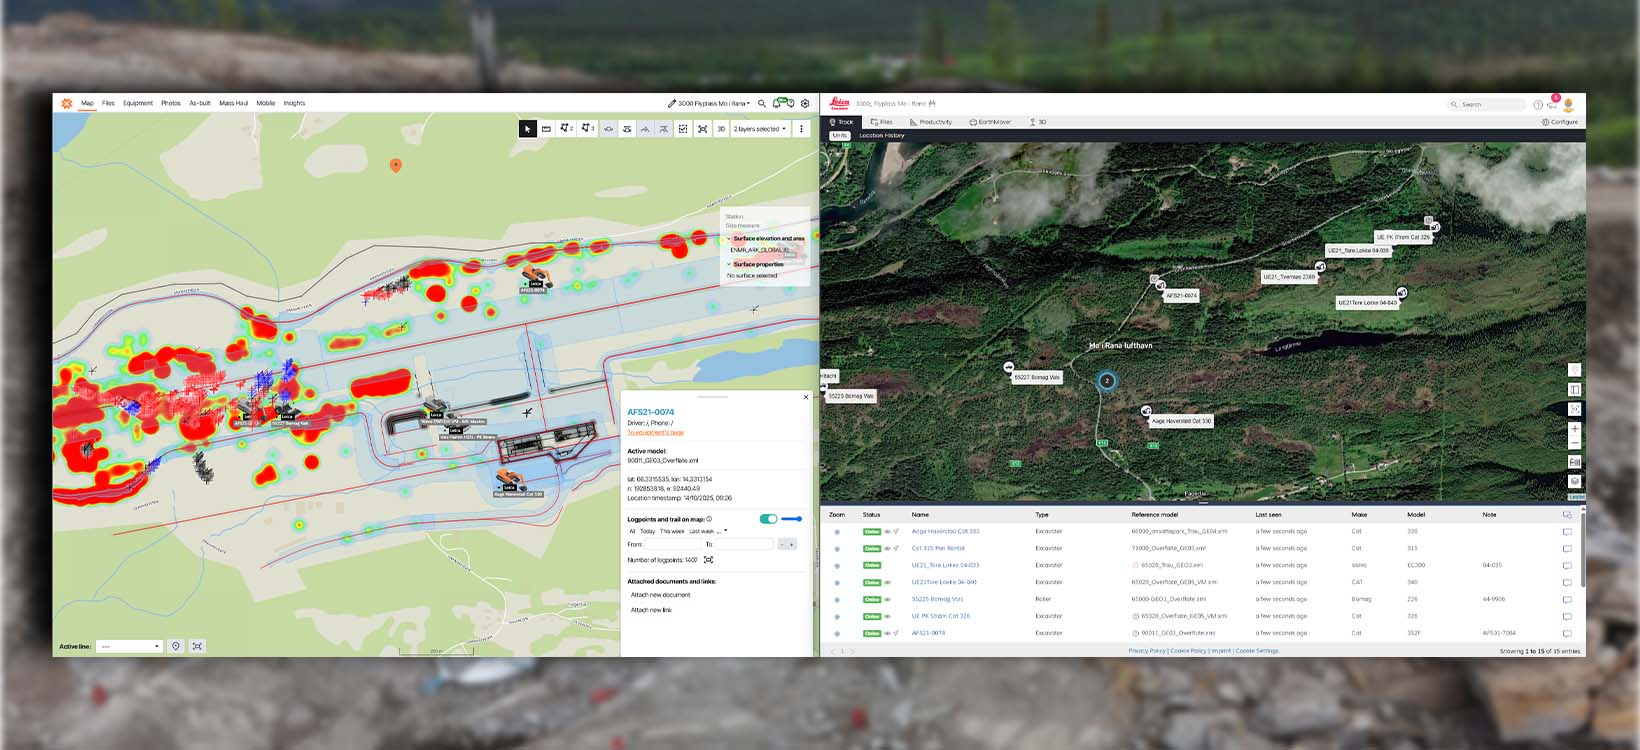
Real-time visibility across the entire alignment. See what's happening at kilometer 5, 15, and 25 without driving between sites. Photos, reports, and quality measurements appear on the project map as they're captured.
Defend warranty claims with documented proof. When defects appear years later, pull up GPS-tagged photos from that exact station number showing original installation. No guessing, no excavation — just proof that survives 5–10 year warranty periods.
Reduce administrative overhead. Your quality managers and surveyors do actual work instead of spending 20 hours weekly organising photos or consolidating reports from email threads.
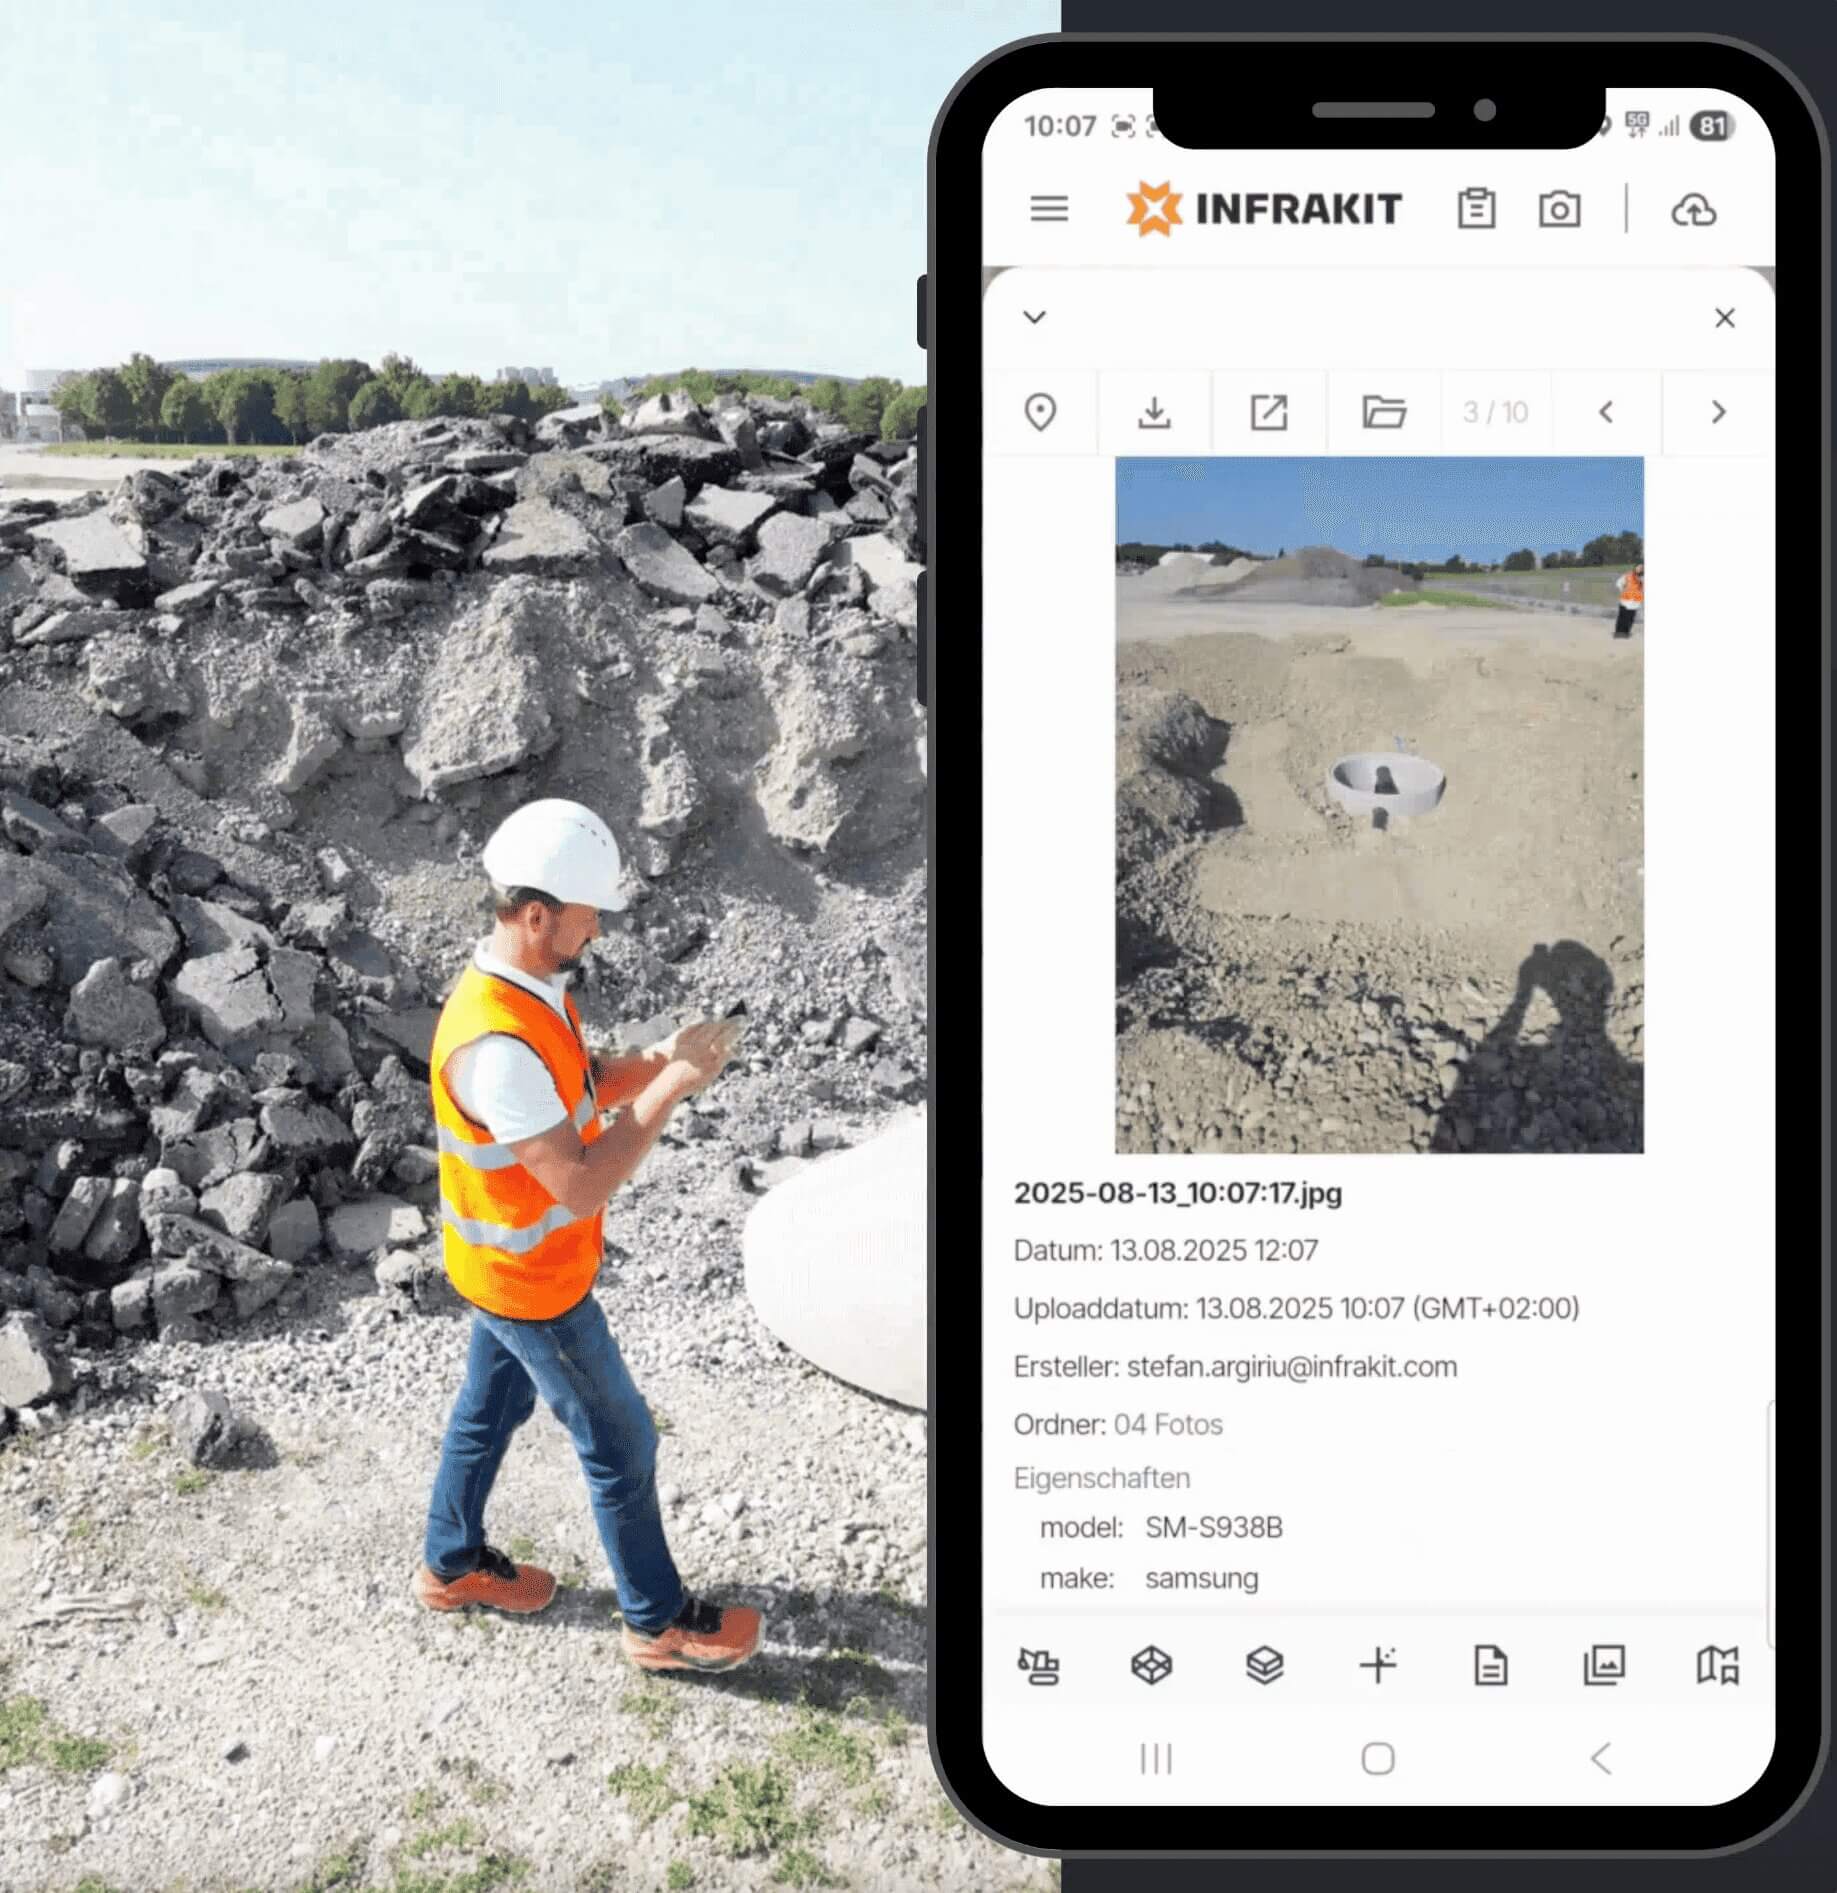
GPS-tagged photos you can find instantly. Take photos on your phone or tablet. GPS coordinates attach automatically. Search by station number or location. Find drainage photos from kilometer 12–15 in seconds.
Field reporting that works offline. Capture photos and file standardised forms even in areas with no connectivity. Everything syncs when connection returns. Works in actual field conditions — with gloves, in rain, in bright sunlight.
Integration with survey equipment. As-built measurements, control points, and machine control data connect to the same map where photos and reports live. No manual data correlation between systems. See the complete approach: 10 Steps to Deliver Infrastructure Projects On Time & On Budget →
See how GPS-tagged field reporting works for infrastructure
Find any photo in seconds by station number. Prove quality years later. Eliminate the 20+ hours per week your team spends organising, searching, and compiling documentation.
"Previously print-outs were the only way to see that the measurements were done right — now all relevant data can be seen by everyone. Before we had metres of quality control folders. Now all the relevant data is in one place."
Heino Karjalainen Site Manager · Destia


Construction field reporting software vs. apps
Desktop or web-based software works from office computers — good for analysis, reporting, and document management. The problem? Field teams won't use it on-site. If they have to walk back to the trailer every time they want to upload a photo, documentation happens hours late. Or it doesn't happen at all.
Construction daily reporting apps take the mobile-first approach. Field teams use phones or tablets to capture photos, fill out reports, and access information without going anywhere. The app needs offline capability — most infrastructure sites don't have consistent coverage. If using the app is slower than just using your phone's camera, people will work around the system.
Integrated platforms combine mobile apps for field teams with web interfaces for office teams, all using the same central database. For infrastructure, this usually means map-based systems where photos, reports, measurements, and design files all display on a project map.
Map-based organisation is particularly good for infrastructure. Everything's geographic — every photo, report, and measurement knows its location. Want to see progress on the entire alignment? Look at the map. Need to find something from kilometer 12? Filter by location.
Most large infrastructure projects end up needing integrated platforms. The investment pays off when you can see complete project status in one place instead of compiling from multiple disconnected tools.
Which do you need? If field crews, surveyors, and office staff all need to work from the same information — and if projects span multiple years — you need an integrated platform. Simple apps work for small contained projects. They don't hold up across 30km and three years. When evaluating systems, ask these questions:
- >Can you search photos by station number and date?
- >Does GPS tagging happen automatically or require manual entry?
- >Can you customise report templates without IT support?
- >How long does it take to find a photo from 6 months ago?
- >What happens if connectivity drops mid-upload?
- >Does it connect to survey, design, and machine control data?
"From my point of view as Quality Manager, Infrakit makes monitoring the project in the field so much easier. There is no need to travel 35 kilometres for every little thing when I can just check it from my PC screen at the office."
Jussi Laamanen Quality Manager · YIT E18 Highway (32km)See how Infrakit Field handles photo documentation and reporting
GPS-tagged photos, standardised mobile forms, map-based organisation, and a complete project archive that survives warranty periods — all in one platform.
Real results from infrastructure projects
Reports that previously took five pages now take two. Quality issues caught immediately instead of after the fact. The project finished ahead of schedule and under budget.
Read more about YIT's E18 project →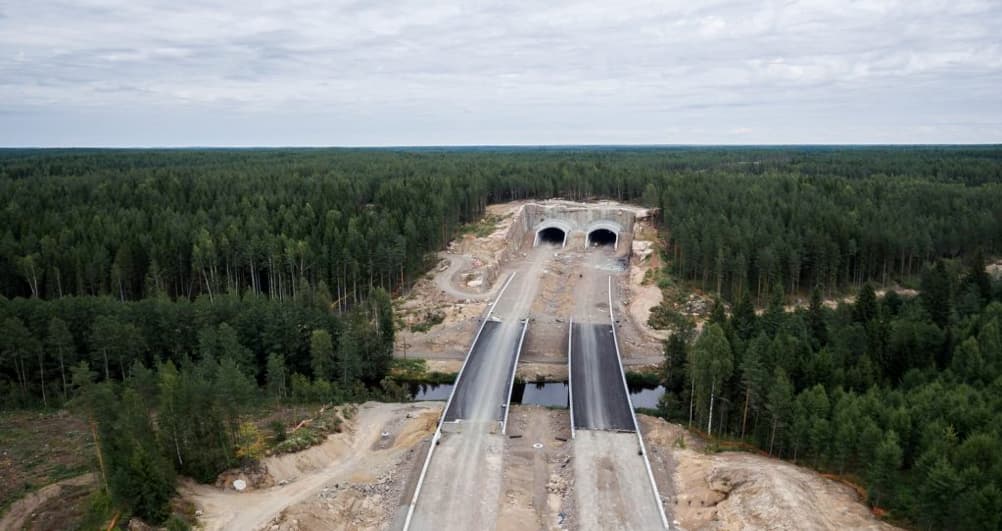
Destia's Riippa-Eskola double-track railway was Finland's largest Design & Build track construction project. Real-time access to as-built data meant quality issues were visible during construction — not discovered after. The project finished on time with a profit margin of over 10%.
"Previously print-outs were the only way to see that the measurements were done right — now all relevant data can be seen by everyone."
Heino Karjalainen Site Manager · DestiaCentralizing drone data, drawings, and field measurements in one platform eliminated an entire layer of administrative back-and-forth. Accurate centimeter-level data became instantly available to every party, removing disputes about measurements and making project transparency a competitive advantage.
"Working this way saves one man, in my estimation, 20 hours of work per week. I directly eliminate an entire series of administrative operations. I save time, and data is immediately available to anyone who needs to work with it."
Jan Boerman Surveyor · Dunnewind GroepCommon patterns across these projects: Setup was quick using templates (minutes instead of hours). Most teams begin by digitizing daily reports first with 2–3 template types (daily progress, safety log, quality check), then add photo documentation once comfortable.
Field teams resisted for a week or two — the key is training on-site champions first, then rolling out to the broader team over 2–3 weeks while focusing on showing field teams how they benefit (finding their own photos, not re-filing reports).
Within 2–3 months teams preferred it because they could find their own information instantly. Office teams appreciated not having to chase people for updates. The benefits lasted well beyond construction — organized archives proved valuable during warranty periods years later.
What didn't work? Desktop tools that required returning to trailers didn't get used consistently. Forms with too many required fields got skipped. Apps without offline mode failed in areas with poor coverage. Skimping on training led to inconsistent usage. And without clear "all photos go through the system" policies enforced by on-site champions, people reverted to texting photos and emailing reports.
If you're wasting hours searching for photos, GPS tagging and location-based organization solves that. If reports come in days late, standardised mobile templates fix it. If your field data is disconnected from design and survey, you need integrated platforms. If you're managing 30+ kilometres of linear infrastructure, map-based organization makes sense.
For large projects — multi-year, complex integration needs — platforms like Infrakit Field that combine mobile capture, desktop analysis, map-based organization, and connections to survey and machine control provide what infrastructure demands.
Documentation that works five years from now
This isn't about finding the perfect tool. It's about matching capabilities to your specific situation. If you're wasting hours searching for photos, GPS tagging solves that. If reports come in days late, standardised mobile templates fix it. If your field data is disconnected from design and survey, you need integrated platforms. If you're managing 30+ kilometres of linear infrastructure, map-based organization makes sense.
For large projects — $20M+, multi-year, complex integration needs — platforms like Infrakit Field that combine mobile capture, desktop analysis, map-based organization, and connections to survey and machine control provide what infrastructure demands. The investment pays off in saved time, prevented rework, improved quality, and defended warranty claims.
More importantly, it gives you the complete project record that infrastructure owners need long after construction ends. Because when that warranty question comes up five years from now, "I think we did it right" isn't good enough. You need to pull up the photo, see exactly where and when it was taken, and prove what happened. Ready to see how? Request a demo →
Frequently asked questions | Can field reporting systems handle offline work? How long does it take field teams to adapt? What happens to photos when team members leave? Do these systems integrate with survey equipment? How do you search for specific photos years later? What's the difference between building and infrastructure field reporting? |